


Updated November 2, 2026 | DRE #02101613
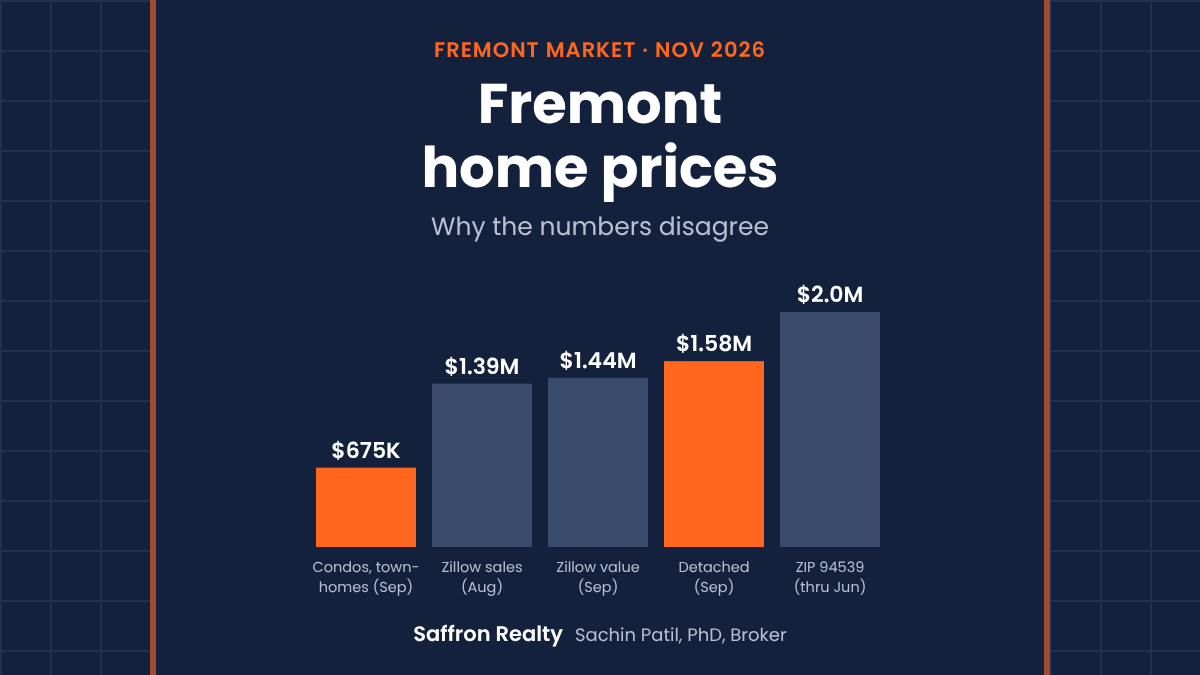
The short answer: There is no single Fremont home price. In September 2026, the median detached home sold for $1,581,500 and the median condo or townhome sold for $675,000.[1][2] Zillow’s typical home value, a modeled figure, was $1,439,805.[3] Market conditions split the same way: detached homes sold at about 103% of list price with 1.4 months of supply, while condos and townhomes sold at about 99% with 3.3 months.[1][2]
If you search for Fremont’s home price, you will get several answers. None of them is necessarily wrong. They are measuring different things, and the difference matters when you are pricing a real house.
Why do Fremont home price numbers disagree?
| Source | Number | What it measures | Period |
|---|---|---|---|
| Bay East[1] | $1,581,500 | Median sale price, detached homes (88 sales) | September 2026 |
| Bay East[2] | $675,000 | Median sale price, condos and townhomes (35 sales) | September 2026 |
| Zillow[3] | $1,391,667 | Median sale price, citywide | August 2026 |
| Zillow[3] | $1,439,805 | Typical modeled home value, down 1.5% in a year | September 2026 |
| Resideline[4] | $1,400,000 | Median sold price across 791 closings | Six months, as of October 2026 |
| TopHap[5] | $2 million | Median sale price, ZIP 94539 only, up 7.1% in a year | Recorded sales through June 2026 |
Four things explain most of the gap:
- Property type. A condo and a detached house are different products. A citywide median blends them, so it moves when the mix of sales changes.
- Geography. A citywide figure and a single ZIP code describe different sets of homes.
- The metric. A sale price is what someone paid. A value index is a model of what homes may be worth, including homes that did not sell.
- Timing. Some numbers cover a month, others cover six months, and recorded data can trail the market by weeks.
The table also shows why a one-line “Fremont is up” or “Fremont is down” tells you very little. Zillow’s citywide value index is down 1.5% over a year,[3] the median detached sale price fell 4.5% from September 2025,[1] and TopHap shows the median sale price in 94539 up 7.1%.[5] Those are different measures of different homes over different periods, so they cannot be compared directly.
Is Fremont a buyer’s or seller’s market?
It depends on the type of home. In the September reports, detached homes favored sellers, while condos and townhomes gave buyers more room.
| Measure | Detached homes | Condos and townhomes |
|---|---|---|
| Median sale price | $1,581,500 | $675,000 |
| Same month in 2025 | $1,656,000 | $830,000 |
| Sale price vs. list price | 103% | 99% |
| Average days on market | 18 | 47 |
| Months of supply | 1.4 | 3.3 |
| Homes sold | 88 | 35 |
Citywide figures can hide that split. Zillow’s August numbers look even, with 47.5% of sales over list and 47.7% under, and a median sale-to-list ratio of 0.998.[3] In that same month, Bay East reported detached homes at 102% of list and condos and townhomes at 99%.[1][2]
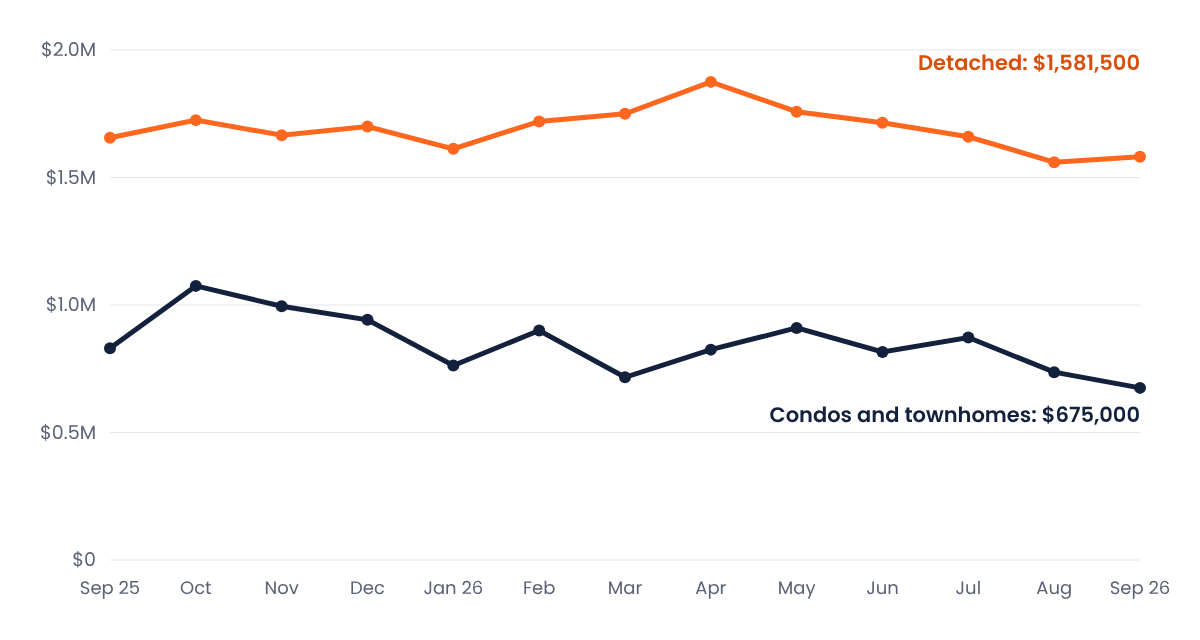
Be careful with the condo and townhome trend. The September median of $675,000 is 18.7% below the $830,000 of a year earlier, but only 35 of these homes sold that month.[2] With so few sales, the median can move a lot depending on which homes closed. It went from $1,075,000 in October 2025 to $675,000 eleven months later, which is not a reliable measure of what any one unit lost in value.
One more detail can mislead people. Zillow’s median list price, about $1.30 million in September, is below its median sale price of about $1.39 million in August.[3] That does not mean buyers are paying about $96,000 over asking. Those are different months and different sets of homes.
How much do Fremont neighborhoods differ?
A lot. Zillow’s September neighborhood values range from about $874,000 in Downtown to about $1.65 million in Glenmoor, with Irvington near $1.24 million.[3] These figures are shaped by the local housing mix, particularly where there are more condos and townhomes, so treat them as a starting point and not as a price for a comparable house.
What this means if you are selling, buying or renting out a home
If you are selling, price from recent comparable sales of your property type near you. A citywide median or automated estimate can be a long way from what your home will bring. My Fremont page explains how I approach pricing across the city.
If you are buying, do not assume the same rules apply to every home. Check the comps and the time on market for that specific property and property type.
If you own a rental, note the contrast. Zillow put average Fremont rent at $3,388 in September, up 6% in a year, while its home value index fell 1.5%.[3] Rent should still be set from nearby rentals like yours.
Fremont home price FAQ
What is the median home price in Fremont, CA?
It depends on the type of home. Bay East reported a median sale price of $1,581,500 for detached homes and $675,000 for condos and townhomes in September 2026. Zillow reported a citywide median sale price of $1,391,667 for August 2026.
Are Fremont home prices going down?
Zillow’s citywide typical home value was down 1.5% year over year in September 2026, and Bay East’s median detached sale price was down 4.5% from September 2025. A single month’s median can be noisy, so check recent sales close to your home.
How long does it take to sell a home in Fremont?
In September 2026, Bay East reported an average of 18 days on market for detached homes and 47 days for condos and townhomes. Zillow showed a citywide median of 20 days to pending. Your timeline will depend on price, condition, location and season.
Is a Zestimate accurate for my Fremont home?
An automated estimate is a reasonable starting point, but it cannot see your condition, upgrades or layout, or tell you how buyers will respond. A valuation built on recent comparable sales will be more specific.
Want a number for your own street?
I will value your home from real comparable sales, walk you through how I got there, and tell you if now is the wrong time to sell.
No obligation. Prefer to talk? Call me at 650-750-6111.
References
- Bay East Association of REALTORS®. “Fremont: Detached Single-Family Homes,” housing report, September 2026. bayeast.org. Deemed reliable but not guaranteed.
- Bay East Association of REALTORS®. “Fremont: Condominiums & Townhomes,” housing report, September 2026. Report (PDF). Deemed reliable but not guaranteed. Accessed November 2, 2026.
- Zillow. “Fremont, CA Housing Market,” data through September 30, 2026. Zillow home values. Accessed November 2, 2026.
- Resideline. “Fremont, CA Housing Market 2026: What Homes Actually Sell For,” updated October 3, 2026. Article. Accessed November 2, 2026.
- TopHap. “TopHap Market Report,” ZIP 94539, recorded sales through June 2026. Report. Accessed November 2, 2026.
Market data in this post comes from the sources listed above and may change. Equal Housing Opportunity.
